Nigeria experiences over 15,000 road crashes annually, resulting in thousands of deaths and injuries.
The Federal Road Safety Corps (FRSC) struggled with outdated reporting methods that took 2+ weeks to
generate insights from crash data. Decision-makers lacked real-time visibility into:
- High-risk time periods when most fatal crashes occur
- Geographic hotspots requiring increased patrol presence
- Primary causes of accidents (speeding, dangerous driving, vehicle defects)
- Seasonal and temporal patterns for resource allocation
Without these insights, FRSC couldn't effectively allocate patrol officers, plan enforcement campaigns,
or target interventions to the roads and times where they'd have maximum impact.
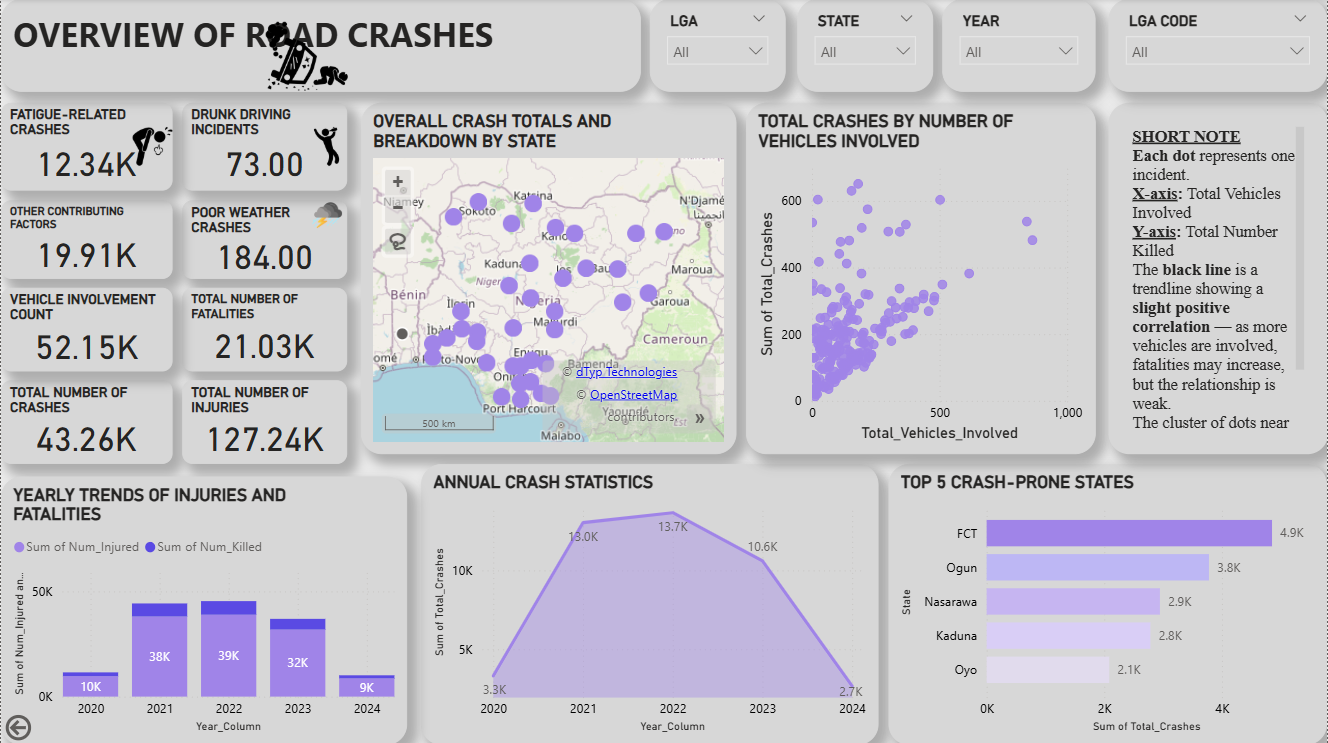
I built an interactive Power BI dashboard that transforms raw crash data into actionable insights
through a systematic data pipeline:
- Data Collection & Cleaning: Processed 15,000+ crash records spanning 2019-2024
across all 36 Nigerian states, standardizing location names, timestamps, and crash categories
- SQL Data Modeling: Structured the data in SQL Server with fact and dimension tables
for efficient querying and analysis
- DAX Calculations: Created complex measures for year-over-year comparisons,
fatality rates, and time-based aggregations
- Interactive Visualizations: Built drill-down capabilities enabling users to explore
data from national level down to individual routes
- Automated Refresh: Implemented scheduled data refresh to keep dashboard updated
with latest crash reports
The dashboard features temporal analysis (by hour, day, month), geographic heatmaps, cause breakdown,
and severity metrics—all filterable by state, route type, and time period.
The dashboard revealed critical patterns that are now driving FRSC policy and resource allocation:
68%
Of fatalities occur on federal highways
42%
Of incidents happen during evening hours (6-9pm)
200-300
Estimated lives saved annually through targeted patrols
Real-time
vs 2-week delay with manual Excel reports
Key Insights Delivered:
- Identified evening rush hour (6-9pm) as the deadliest time period, enabling optimized patrol scheduling
- Federal highways account for 68% of fatalities despite lower traffic volume, indicating infrastructure issues
- Speed violations and dangerous driving are top causes, informing enforcement priorities
- December shows 23% spike in crashes, supporting targeted holiday season campaigns
FRSC leadership now uses this dashboard in weekly planning meetings to allocate patrol officers,
plan public awareness campaigns, and advocate for road infrastructure improvements with data-backed evidence.
Development Process: Data extraction from FRSC databases → Excel preprocessing →
SQL Server storage → Power BI modeling → DAX measure creation → Interactive visualization →
Power BI Service deployment
Key Technical Challenges: Handling inconsistent location naming across states,
dealing with incomplete records, creating time intelligence calculations for year-over-year comparisons,
and optimizing dashboard performance for large datasets.