A retail analytics team was drowning in manual data processing. Every week, analysts spent 8+ hours:
- Downloading CSV files from 5 different systems (POS, inventory, CRM, marketing, e-commerce)
- Manually cleaning data: fixing date formats, handling nulls, removing duplicates
- Copy-pasting between Excel sheets to merge datasets
- Running VLOOKUP formulas prone to #N/A errors
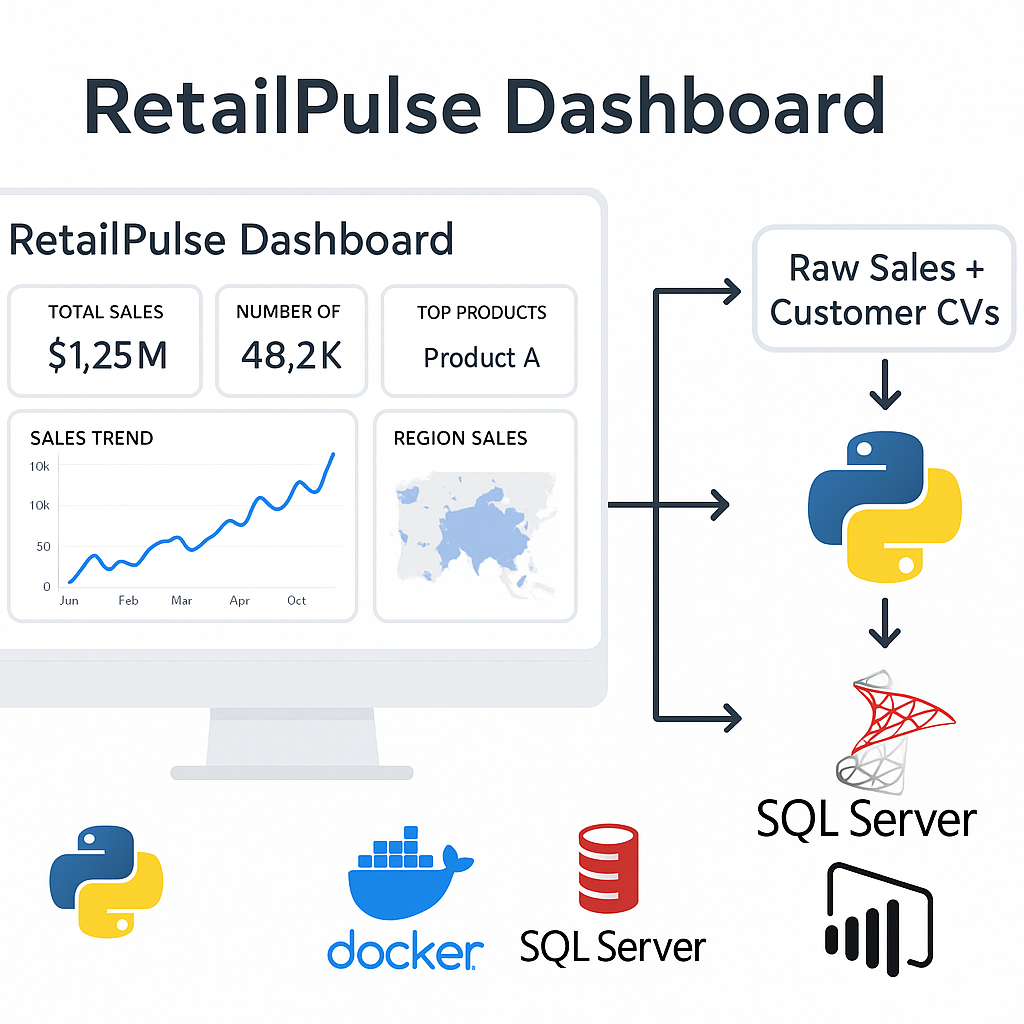
- Uploading final dataset to Power BI for visualization
This manual process caused 15+ errors per cycle, delayed reporting by weeks, and prevented the team
from doing actual analysis. The business couldn't respond quickly to market trends because data was
always outdated. Analysts were stuck doing data janitor work instead of generating insights.
I built an end-to-end automated ETL pipeline that handles everything from data extraction to
Power BI visualization:
- Python ETL Engine: Used Pandas and NumPy to ingest data from multiple file
formats (CSV, Excel, JSON), apply transformations, and perform data quality checks
- Data Validation: Implemented automated checks for data types, null values,
duplicate records, and business rule violations—rejecting bad data before it enters the warehouse
- SQL Server Integration: Loaded cleaned data into SQL Server with proper
indexing for fast querying by Power BI
- Dockerization: Containerized the entire pipeline so it runs consistently
across development, testing, and production environments
- Scheduling & Monitoring: Set up weekly automated runs with error logging
and email alerts for failed jobs
The pipeline is modular and scalable—new data sources can be added by simply creating a new
ingestion module without touching the core transformation logic.
80%
Time savings (8hrs → 1.5hrs per week)
0
Errors (eliminated 15 per week)
50,000+
Transactions processed weekly
Weekly
vs monthly reporting cadence
Tangible Business Outcomes:
- Faster Decision Making: Reports now generated weekly instead of monthly,
allowing quicker response to market trends
- Error Elimination: Automated validation catches data issues before they
reach stakeholders, maintaining trust in analytics
- Analyst Productivity: Team redirected 80% of freed time to strategic analysis,
customer segmentation, and predictive modeling
- Scalability: System handles 3x data volume growth without additional manual effort
- Consistency: Docker ensures the pipeline runs identically across all environments,
eliminating "it works on my machine" issues
The business now has confidence in their data and can trust automated reports without
manual verification. Executive leadership uses the dashboards in weekly reviews to make
inventory, pricing, and marketing decisions.
Pipeline Architecture: Data ingestion (Python) → Transformation & validation
(Pandas/NumPy) → SQL Server storage → Power BI visualization → Scheduled automation (Docker)
Key Technical Challenges Solved:
- Handling inconsistent date formats across different source systems
- Implementing incremental loads to process only new/changed records
- Creating robust error handling that logs issues without crashing the pipeline
- Optimizing SQL inserts for bulk loading 50,000+ records efficiently
- Designing a modular codebase that's easy for other developers to maintain
The code is thoroughly documented with inline comments, includes unit tests for critical functions,
and follows PEP 8 style guidelines. The GitHub repository has a detailed README with setup
instructions and architecture diagrams.