Retail businesses face a constant dilemma: how much inventory to stock. The challenges are significant:
- Overstocking: Ties up capital in unsold inventory, increases storage costs,
and leads to markdowns that erode profit margins
- Understocking: Causes lost sales, damages customer satisfaction, and gives
competitors an opportunity to capture market share
- Seasonal Variability: Sales patterns fluctuate dramatically by season,
making it hard to predict future demand
- Regional Differences: Different US markets have vastly different buying patterns
and preferences
Traditional forecasting methods (like "last year plus 10%") fail to capture complex seasonal patterns,
trend changes, and market dynamics. Manual forecasting in Excel is time-consuming, inconsistent, and
doesn't provide confidence intervals to quantify uncertainty.
I built a comprehensive time-series forecasting solution that combines statistical rigor with
practical business application:
- Exploratory Data Analysis: Analyzed historical sales data to identify trends,
seasonality, and outliers using Pandas and visualization libraries
- Feature Engineering: Created time-based features (month, quarter, holiday indicators)
and calculated rolling averages to capture momentum
- Prophet Modeling: Implemented Facebook Prophet for automatic detection of yearly
seasonality, weekly patterns, and holiday effects
- ARIMA Modeling: Built traditional ARIMA models for comparison and to capture
autocorrelation patterns in the time series
- Model Evaluation: Compared models using RMSE, MAE, and MAPE on holdout test data
to select the best performer
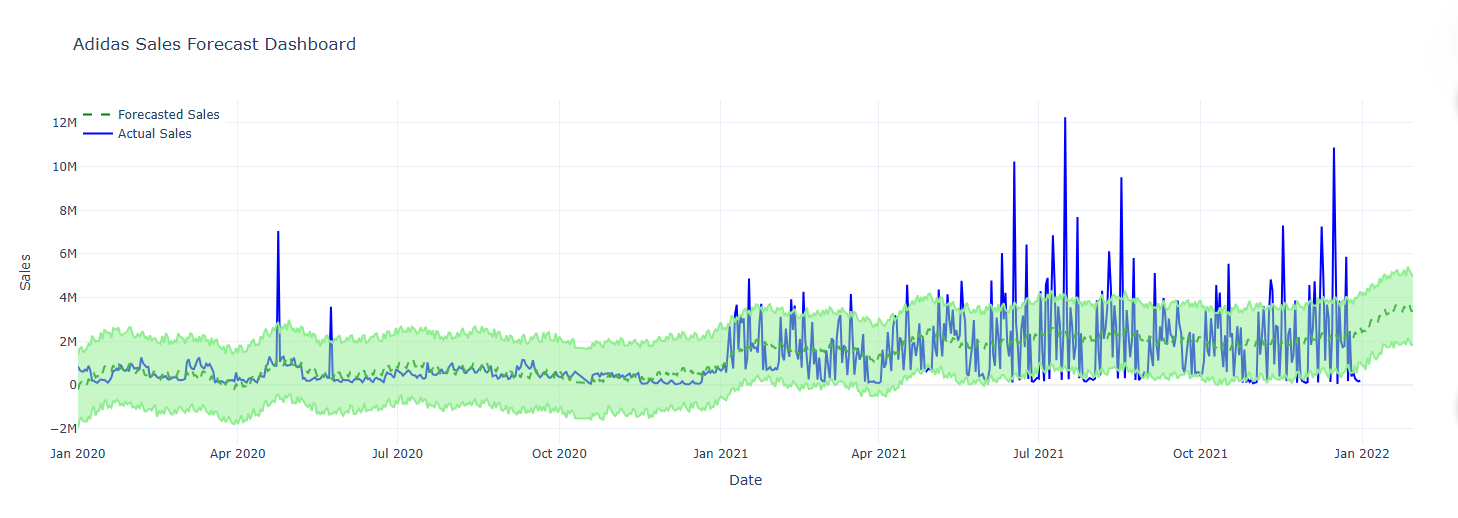
- Power BI Integration: Exported forecasts with confidence intervals to Power BI
for stakeholder dashboards
The solution provides 12-month forward forecasts with upper and lower bounds, allowing planners to
balance risk tolerance with inventory decisions.
85%+
Forecast accuracy (MAPE)
12 months
Forward-looking predictions
Seasonal
Pattern identification
Automated
Power BI refresh
Key Insights Delivered:
- Q4 Sales Spike: Model identified 38% increase in Q4 sales, enabling proactive
inventory buildup for holiday season
- Regional Patterns: West Coast shows 23% higher summer sales compared to other regions,
informing regional allocation
- Product Mix Shifts: Footwear sales growing 15% YoY while apparel flat,
suggesting portfolio rebalancing
- Confidence Intervals: Upper/lower bounds help planners make risk-adjusted decisions
(order conservatively vs aggressively)
- Early Warning System: When actual sales deviate from forecast by 15%+,
alerts trigger investigation into market changes
The forecasting model is now used monthly by supply chain planners to make purchasing decisions
6-12 months in advance. The confidence intervals allow them to order base quantities at the lower
bound, with option to order more if demand signals strengthen.
Modeling Workflow: Data ingestion → EDA & visualization → Feature engineering →
Train/test split → Prophet & ARIMA training → Model evaluation → Hyperparameter tuning →
Forecast generation → Power BI export
Technical Highlights:
- Prophet Configuration: Tuned yearly seasonality strength, added custom holiday
calendar (Black Friday, Christmas), and adjusted changepoint sensitivity
- ARIMA Selection: Used auto ARIMA to find optimal (p,d,q) parameters through
AIC minimization
- Cross-Validation: Implemented time-series cross-validation with expanding window
to avoid data leakage
- Ensemble Approach: Combined Prophet and ARIMA forecasts weighted by historical
performance for robust predictions
- Automated Reporting: Script exports forecast CSV that Power BI imports automatically,
updating dashboards monthly
All code is well-documented in Jupyter notebooks with markdown explanations of methodology,
model selection rationale, and interpretation of results. The GitHub repository includes
sample data and step-by-step instructions for reproduction.